


If you can query Prometheus, you can read everything in it: every label, every metric, every tenant’s data. PromQL has no idea who is asking.
That was fine when one team ran one Prometheus. Today a single Prometheus, or a shared backend behind it, often serves dozens of teams and sometimes paying customers. One curl from any pod can return another team’s customer IDs and revenue, list the names of every tenant’s secrets, or run a seven-day query that slows the shared database for everyone. There is no setting to switch on that stops it.
The fix came from somewhere unexpected. Earlier this year I worked on securing AI agents’ tool calls over the Model Context Protocol (MCP): an agent asks to run a tool, and a policy layer decides whether that call is allowed before it executes. A PromQL query is the same shape. So, we treated every PromQL query like a tool call and put a policy layer in front of Prometheus, without forking it or waiting for a roadmap item.
Anushka Saxena and I presented this work at PromCon EU 2026 in Munich as Least-Privilege Metrics: Securing PromQL in Multi-Tenant Clusters, with the demo on stage. You can view the slides here.
Prometheus and Multi-Tenancy Today
Prometheus is a CNCF’s graduated monitoring system. It scrapes metrics from your services over HTTP, stores them in a local time-series database (TSDB) and answers questions in its query language, PromQL. It was designed as a single tenant system: one server, one team, and anyone who can reach its API sees everything in it.
When several teams or customers share metrics, people usually reach for one of these options:
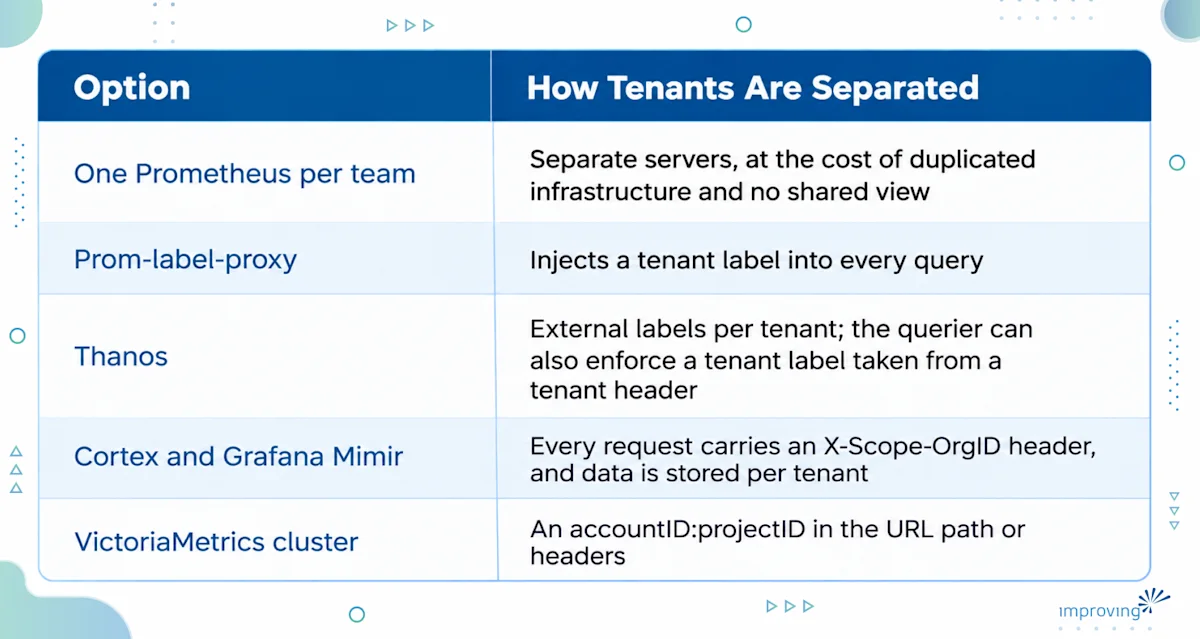
All these answer “whose data” once the tenant is known. None of them decides who the caller is, which metrics they may read, or how expensive a query may be. That gap is what this blog post is about.
Take a common setup. A platform team runs one shared Prometheus for two product teams and puts prom-label-proxy in front of it, so team-a only sees namespace="team-a" and team-b only sees namespace="team-b". Isolation solved. But:
Who is asking? prom-label-proxy trusts the tenant header it receives. Any pod that can reach it can send X-Tenant: team-a and read team-a's data.
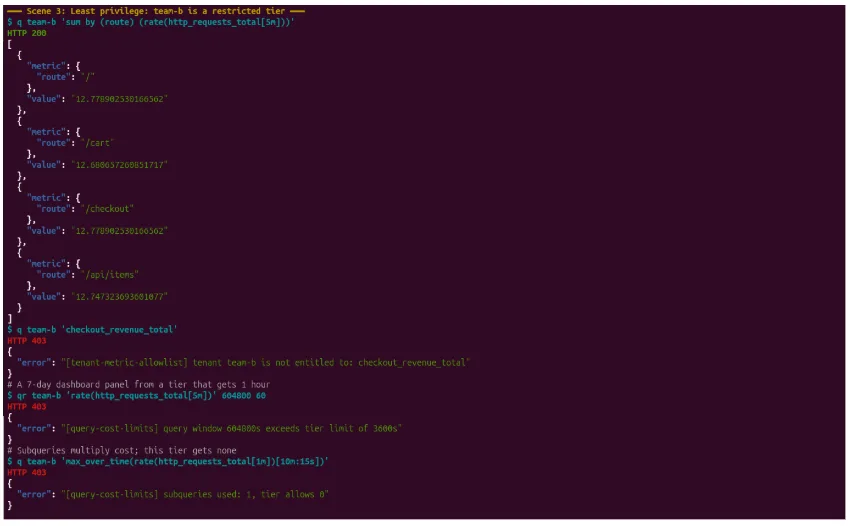
Which metrics? team-b is a partner team that should see request rates but not revenue per customer_id. Namespace isolation can't express that. Inside its own namespace, team-b reads everything.
How expensive? A team-b dashboard panel set to "last 30 days", with a subquery and a 30-second refresh, keeps the shared TSDB busy. Team-a's queries slow down, and nothing in the stack prices or limits it.
Each of these is a decision about the request itself, not just the data, and none of these tools make it.
Problem: PromQL has No Authorization Model
Prometheus was built for one team watching its own systems. There is no concept of who is asking the query. Today a single Prometheus or a shared backend behind it, often serves dozens of teams, and sometimes paying customers.
Here is what that means in practice. From a pod in team-a's namespace, Prometheus is one service away:
# run from a pod inside team-a's namespace (the demo's toolbox pod)

kubectl -n team-a exec toolbox -- curl -s -G \
  http://prometheus.monitoring.svc:9090/api/v1/query \
  --data-urlencode 'query=checkout_revenue_total'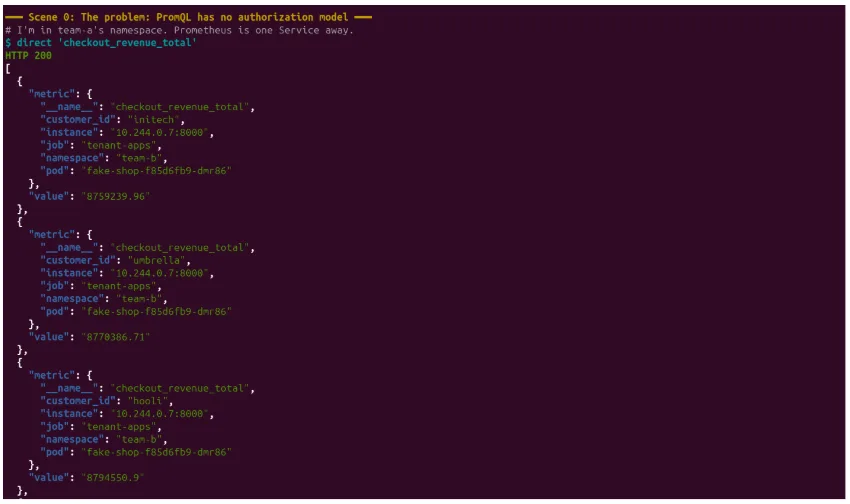
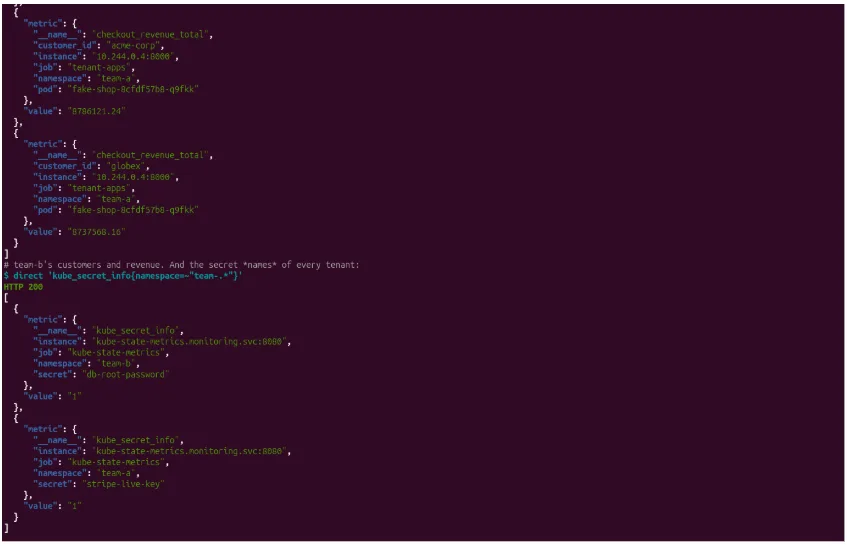
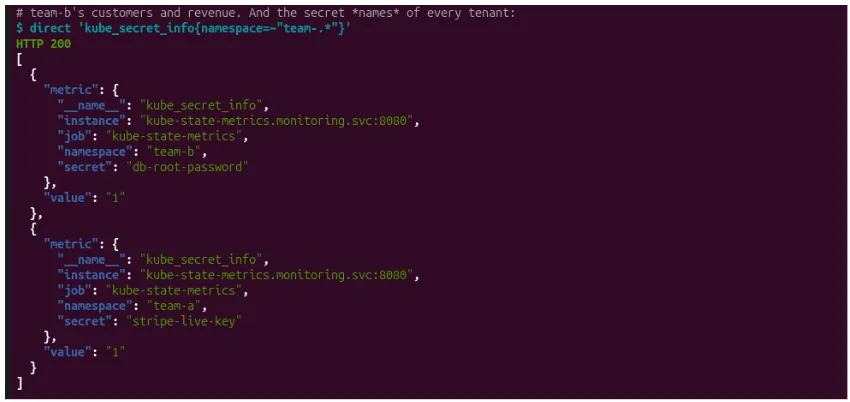
That one request returned revenue for every customer in the cluster, including team-b's customers. We didn't break anything or misconfigure anything to get this. It's simply how Prometheus behaves out of the box.
Three kinds of damage follow from it:
Data leakage: Labels like customer_id, hostnames, and tenant names are readable by anyone with query access.
Sensitive metadata: kube-state-metrics expose kube_secret_info. Our query lists every tenant's secret name, including stripe-live-key and db-root-password.
Noisy neighbours: Nothing stops one tenant from running a seven-day subquery that slows the shared TSDB for everyone else.
Solution: A Policy Gate in Front of an Unmodified Prometheus
An AI agent calling an MCP tool and a dashboard calling /api/v1/query share the same four parts: an identity, an action, arguments, and a resource that doesn't know who's asking. We solved the MCP version with a policy proxy, so we built the same thing for PromQL: a small gate, promql-gate, that every query passes through.
Each request goes through five steps:
Authenticate: The client sends its Kubernetes ServiceAccount token. The gate calls TokenReview and maps the verified identity to a tenant.
Parse: The gate asks Prometheus to parse the query through /api/v1/parse_query. We never re-implement PromQL, so the gate and the engine can't disagree about what a query means.
Decide: The gate turns the parsed query into a flat JSON document and evaluates it with Kyverno.
Budget: The gate estimates how many samples the query will read and charges that to the tenant's budget.
Rewrite: prom-label-proxy injects namespace="<tenant>" into every selector, so even a query the policy didn't anticipate can only see the tenant's own data.
Prometheus itself is never modified. A Network Policy completes the picture: only the gate namespace may reach Prometheus, so there's no way around the gate.
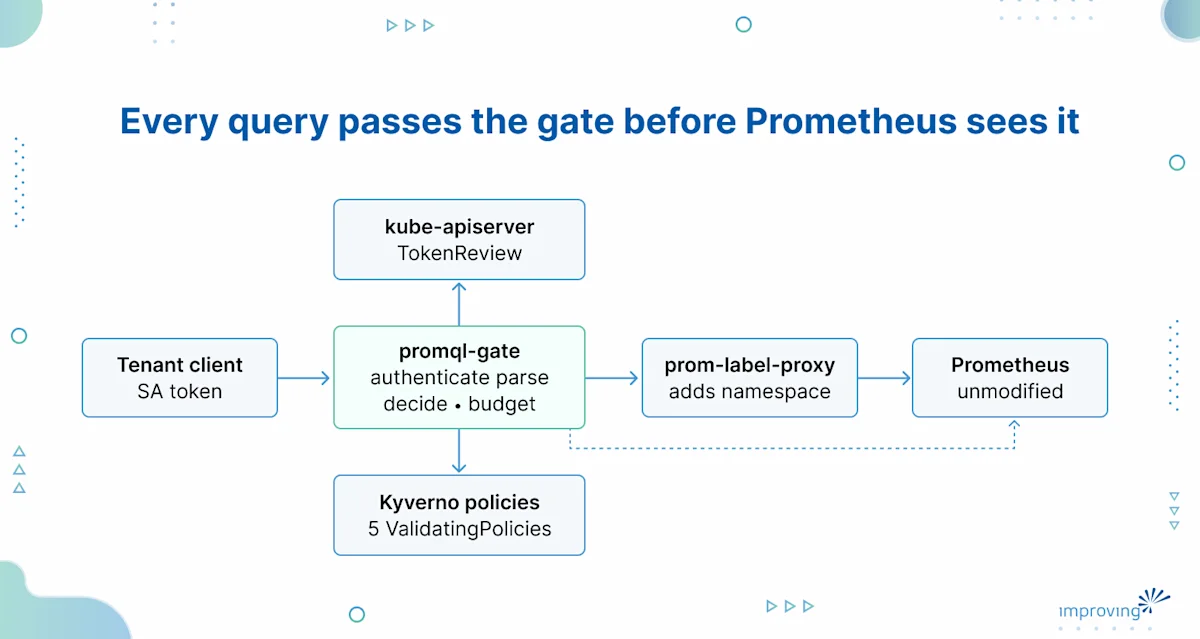
The gate check's identity with the API server, asks Prometheus to parse the query, and decides with Kyverno before anything is forwarded.
The query as a JSON document
Kyverno 1.19 can evaluate ValidatingPolicy resources against arbitrary JSON, not just Kubernetes objects. The gate describes each query like this:
{
  "kind": "PromQLQuery",
  "tenant": "team-b",
  "metrics": ["http_requests_total"],
  "functions": ["rate"],
  "subqueries": 0,
  "maxLookbackSeconds": 900,
  "windowSeconds": 3600,
  "estimatedSamples": 14701
}
Policy authors write a few lines of CEL against this document and never need to know PromQL grammar. Here is the tenant-isolation rule:
apiVersion: policies.kyverno.io/v1
kind: ValidatingPolicy
metadata:
  name: tenant-isolation
spec:
  evaluation:
    mode: JSON
  validations:
  - expression: >-
      object.selectors.all(s, s.matchers.all(m,
        m.name != 'namespace' ||
        (m.type == '=' && m.value == object.tenant)))
    messageExpression: "'tenant ' + object.tenant + ' may only select namespace=\"' + object.tenant + '\"'"
Five policies, one decision
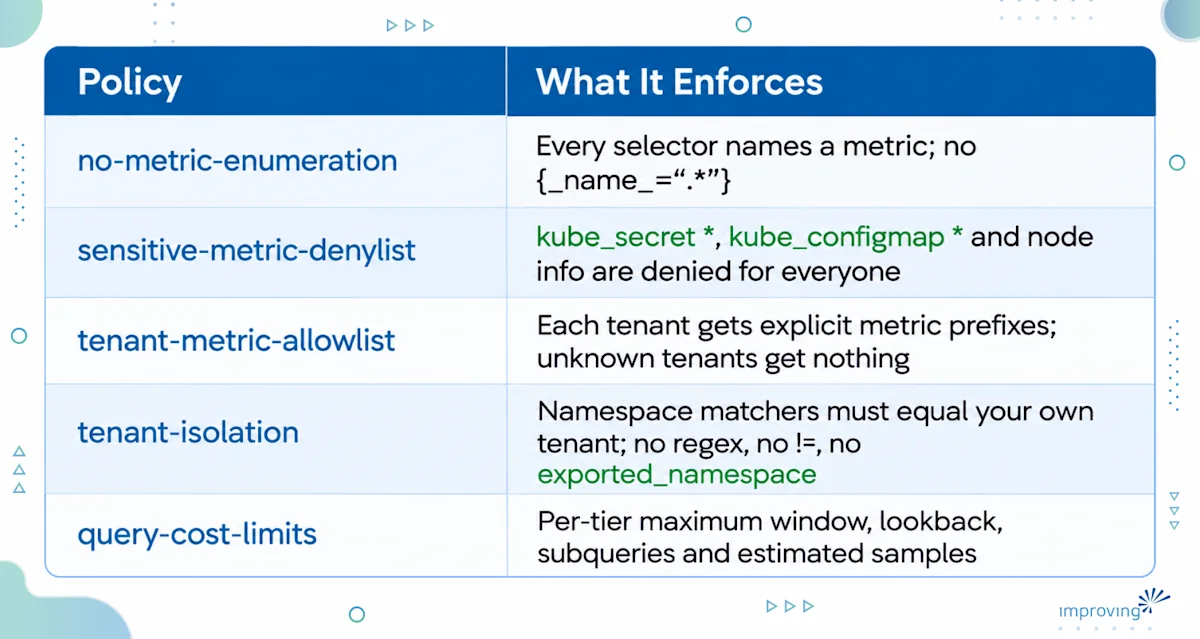
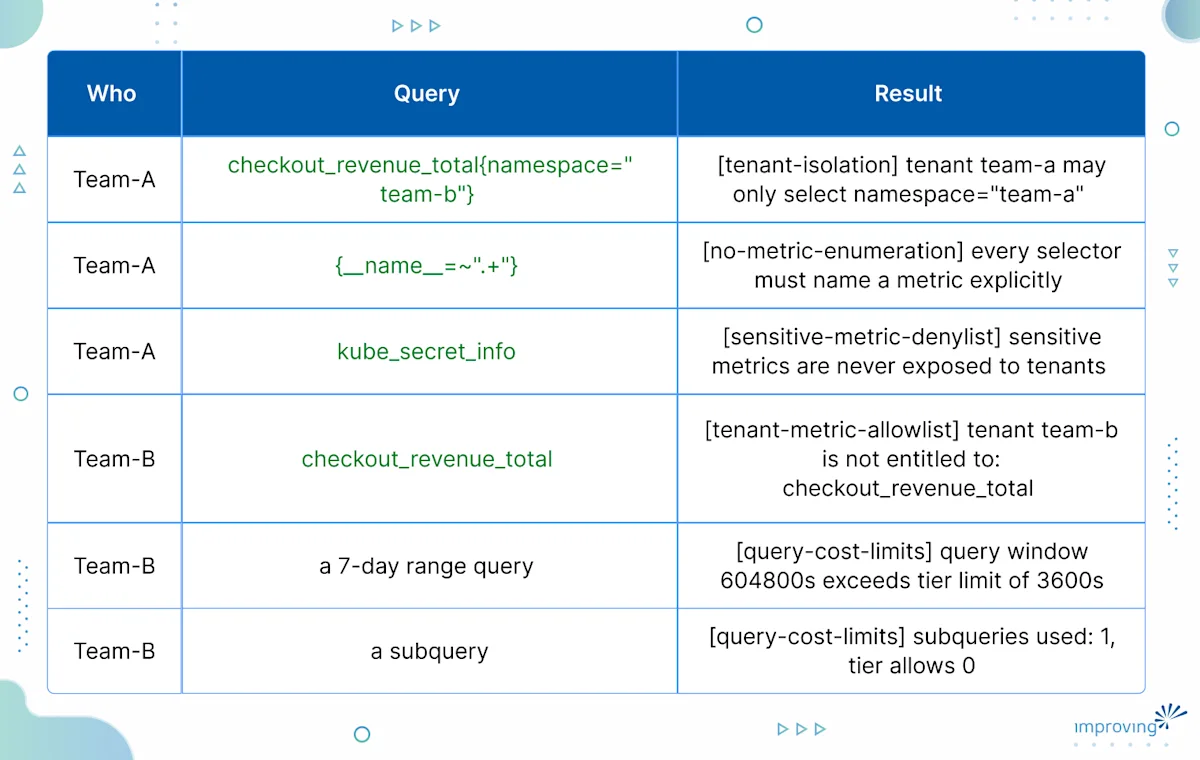
Every denial names the policy that fired. That matters for adoption: a 403 that explains itself beats a dashboard that silently goes empty.
Cost-Aware Rate Limiting
Counting requests doesn’t work for PromQL, because one query can cost a thousand times together. The gate prices each query by the samples it will read:
samples per evaluation = lookback ÷ scrape interval + 1 (summed over selectors) evaluations = window ÷ step + 1 (for range queries) subqueries multiply the cost of what they contain
The per-query ceiling lives in the Kyverno policy, which is stateless. The per-minute budget lives in the gate as a token bucket, because it has to remember what each tenant has already spent.
Demo: Two Tenants, One Shared Prometheus
In the demo, two teams share one Prometheus. First, we skip the gate and show how much one team can read about the other. Then we send every query through the gate and watch what it does: rewrite a broad query so it only returns the caller's own data, refuse queries that cross tenants or touch sensitive metrics, rate-limit an expensive dashboard, shrug off attempts to fool it, and finally change a team's access with a one-line policy edit.
Prerequisites
You need these on your machine:
Docker
kind or later (its default network plugin enforces NetworkPolicy, which the demo relies on)
kubectl, helm, jq, and curl
The setup script builds everything else:
monitoring namespace: Prometheus 3.15 with its query log on, and kube-state-metrics
promql-gate namespace: the gate (with the Kyverno 1.19 CLI inside), prom-label-proxy 0.15, and the five policies as a ConfigMap
team-a and team-b namespaces: a small "shop" exporting request and revenue metrics per customer_id, a metrics-reader ServiceAccount, and a toolbox pod for running curl from inside the namespace
The two tenants are set up differently on purpose:
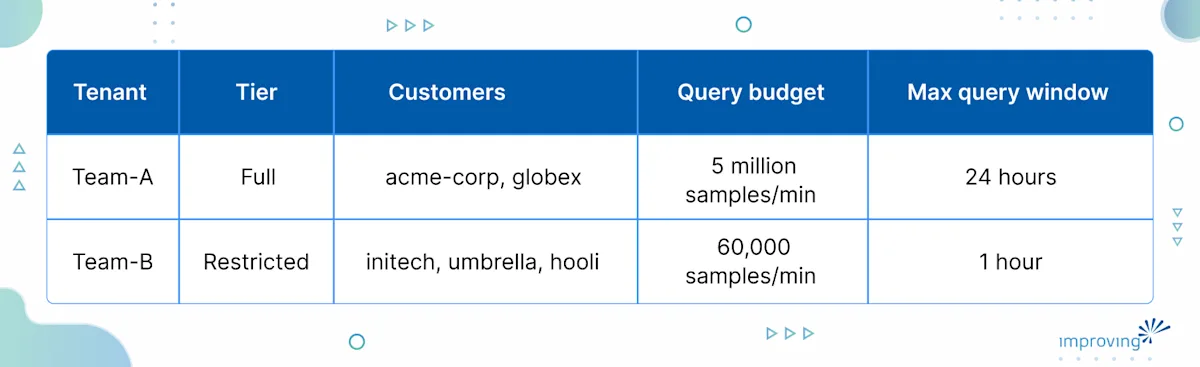
Get the code
Everything is on this GitHub repository. It holds the gate, the five Kyverno policies, the Kubernetes manifests, and the demo script. To run it:
git clone https://github.com/improving/least-privilege-metrics-promcon-munich-2026.git && cd least-privilege-metrics-promcon-munich-2026

./setup.sh          # kind cluster + everything above, about 3–4 minutes
./demo.sh reset     # start from a clean state
./demo.sh           # step through the scenes, Enter to advance
Each tenant queries with its own ServiceAccount token. Prometheus' query log shows what actually ran after the gate.
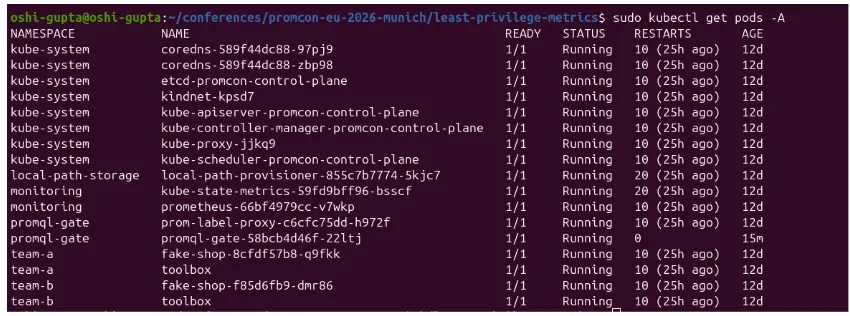
Rewritten, Not Trusted
team-a asks a deliberately broad question: sum by (namespace, customer_id) (checkout_revenue_total). It gets back only acme-corp and globex. Prometheus' query log shows why:
Prometheus executed: sum by (namespace, customer_id) (checkout_revenue_total{namespace="team-a"})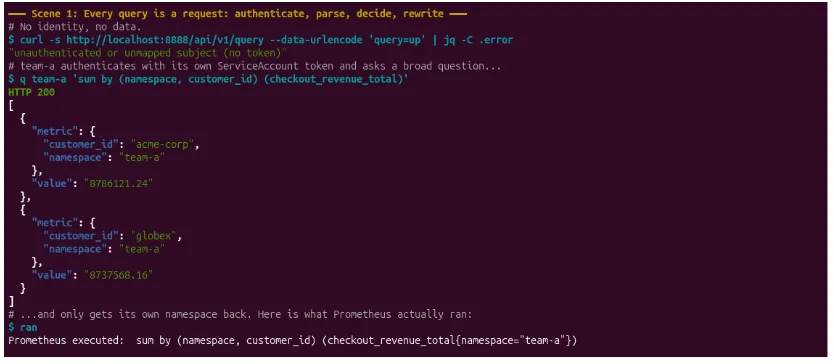
team-a never asked for that namespace filter. The gate added it before the query reached Prometheus.
Refused With a Reason
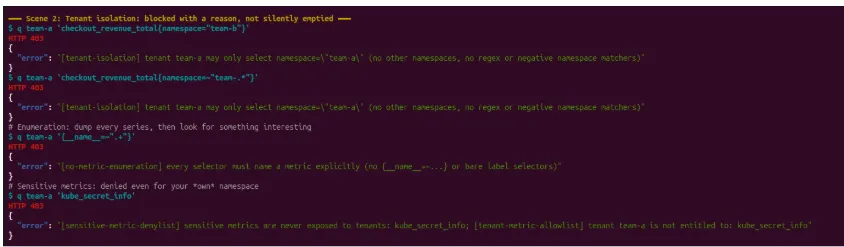
Every attempt to step outside a tenant's lane gets a 403 naming the policy that fired:
Rate Limited by Cost, Not by Count
team-b sends the same one-hour range query seven times: sum by (route)(rate(http_requests_total[15m])) with a 15-second step. Each costs 61 samples per evaluation × 241 evaluations = 14,701 samples:
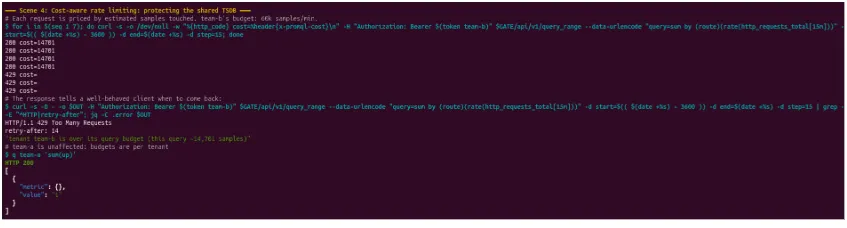
Four queries fit in the 60,000 budget. The fifth is refused with 429 Too Many Requests and retry-after: 14, before it ever reaches Prometheus. team-a, querying at the same moment, still gets a 200.
Attacking The Gate Itself
A policy proxy is an attack surface too. Two of these were real bugs we hit while building the demo:
Header spoofing: prom-label-proxy trusts the X-Tenant header. Sending X-Tenant: team-b with team-a's token still returns only team-a's data, because the gate drops client headers and sets the tenant from the verified identity.
Parameter pollution: With ?query=up in the URL and query=kube_secret_info in the body, the gate could approve one query while Prometheus runs another. The gate now rejects duplicate parameters.
Side endpoints: /api/v1/admin/tsdb/snapshot and /federate return endpoint ... is not exposed to tenants. Endpoints are allowlisted, not blocklisted.
Closing The Side Door
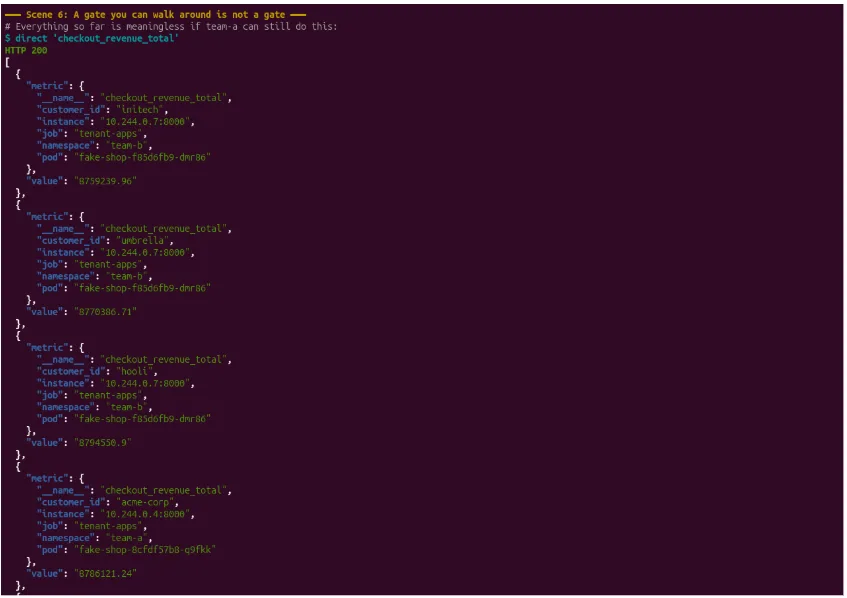
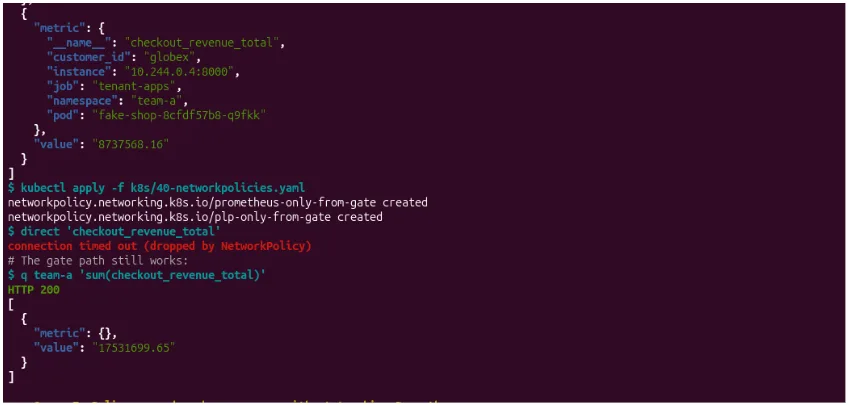
A gate you can walk around is not a gate. Before the NetworkPolicy, team-a's pod can still curl Prometheus directly and read everything. After kubectl apply -f k8s/40-networkpolicies.yaml, the same request gets no answer at all (connection timed out (dropped by NetworkPolicy)), while queries through the gate keep working.
Policy As Code
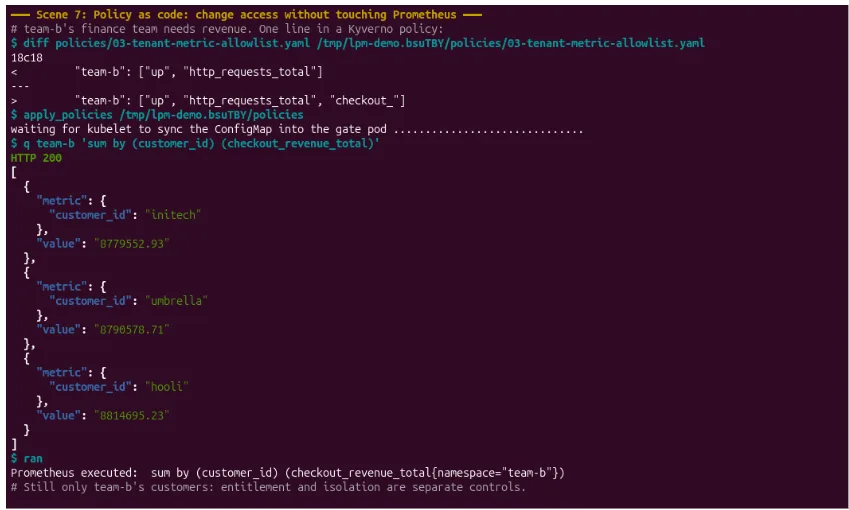
Finally, team-b's finance team needs revenue data. That's a one-line change to the allowlist policy:
Once the ConfigMap syncs, team-b can read revenue with no restart of Prometheus or the gate, but still only for initech, umbrella and hooli. Entitlement (which data) and isolation (whose data) are separate controls.
What About the Prometheus UI and Grafana?
Prometheus UI: It is the built-in UI that is served by Prometheus itself, so once the NetworkPolicy is in place, tenants can't reach it. It can't simply sit behind the gate either: it sends no token and relies on endpoints the gate doesn't expose. Treat it as an operator-only tool and restrict kubectl port-forward to Prometheus with RBAC, since port-forwarded traffic isn't covered by NetworkPolicy.
Grafana: Point the Prometheus datasource at the gate instead of the Prometheus. Queries pass through the same checks, and a 403 or 429 shows up in the panel with the gate reason. The catch is identity: a datasource with one ServiceAccount token makes every viewer the same tenant. The practical setup today is one datasource per tenant, scoped to that team's Grafana org or folder. Per-user identity would need Grafana's OAuth forwarding plus OIDC validation in the gate. Dashboard refreshes also count against the tenant's budget, so a busy dashboard can rate-limit its own team.
Conclusion
A policy gate gives Prometheus the authorization model it was never designed to have, using tools most clusters already run. It isn't a finished product, though, and we were deliberately honest on stage about where it breaks down:
Recording rules that drop the tenant label produce series no tenant can be scoped to. Enforce label preservation on PrometheusRule objects at admission time.
Dashboards usually query with one shared Grafana identity, so the gate sees a single tenant. Per-user identity has to be forwarded.
Label and metadata APIs are namespace-scoped but skip the metric allowlist.
Cost estimation ignores cardinality: 10 series and 10 million series cost the same.
Rate-limit state lives in memory per replica; scaling out needs shared state.
Policy latency with the Kyverno CLI is about 0.7 s for a cold decision and about 6 ms cached. Production should embed the Kyverno library.
The tenant label must come from relabelling based on service discovery, never from the app itself.
The pattern also carries over to Thanos, Cortex, and Mimir. Only the last step changes: instead of injecting a label, the gate sets X-Scope-OrgID or the Thanos tenant header from the verified identity, and the backend's own tenancy does the isolation.
If you take three things away from this blog post:
A PromQL query is a request. Authenticate it, understand it, and decide on it.
Layer your controls. Rewrite what you allow, explain what you deny, and close every other path.
Keep authorization outside the TSDB, as policy you can change without a Prometheus release.
If you would like to share your comments on this article, you can find me on LinkedIn. If you want help putting this into practice, Improving’s observability team can help you strengthen access controls for Prometheus, enforce tenant-level query policies, and secure observability data without forking Prometheus.